
Unlocking the Secrets of Performance: A Deep Dive into Expert CPU Profiling Techniques
Understanding CPU Profiling CPU profiling helps you discover how your program uses the CPU. It's like having a health checkup for your software. By seeing how the CPU spends its time, you can find ways to make it faster and more efficient. Why Is CPU Profiling Important? Improves Performance: Find and fix slow parts of your code. Reduces Resource Use: Use less CPU power for the same tasks. Enhances User......
Read More →
Memory Profiling Demystified: Best Practices for Optimizing Application Performance
Understanding Memory Profiling Memory profiling is all about checking how your application uses memory. It's like keeping an eye on your belongings to make sure nothing gets wasted or lost. When your app uses memory poorly, it can slow down or even crash. So, memory profiling helps us figure out where the problems are. Why It Matters Good memory management can make your app faster and more efficient. Here’s why......
Read More →
JIT Log Analysis: How to Interpret Just-In-Time Compilation Logs for Better Performance Insights
Understanding JIT Compilation Logs Just-In-Time (JIT) compilation boosts the speed of software by compiling code while the program runs. JIT logs help us see what's happening behind the scenes. Analyzing these logs gives us valuable insights into how to improve performance. Why JIT Log Analysis Matters JIT log analysis lets developers catch performance issues early. Here’s why it’s essential: Identify bottlenecks: Find out which parts of your code are slowing......
Read More →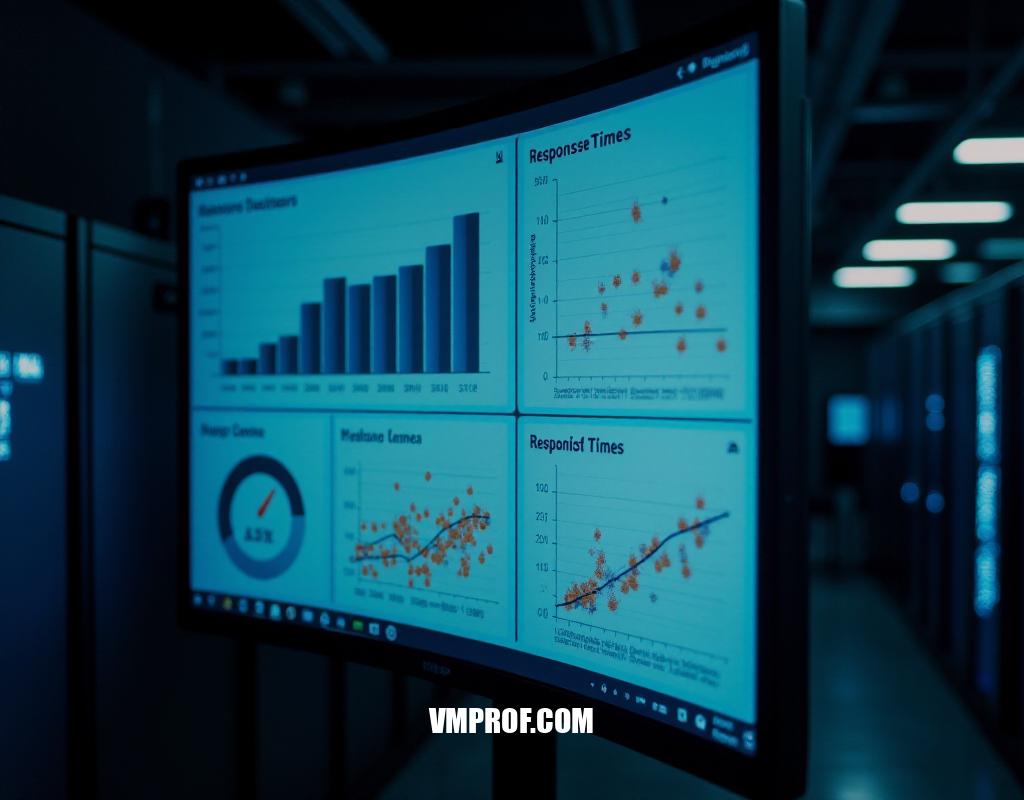
Visualizing Performance Metrics: Tools and Techniques for Effective Performance Visualization
Introduction to Performance Visualization Visualizing performance metrics helps us see how we’re doing. It makes complex data easy to understand. Whether for business, sports, or personal goals, clear visuals help inform decisions. Why Visualize Performance Metrics? When we visualize data, we make it easier to spot trends, track progress, and communicate results. Good visuals lead to better insights. Here’s why performance visualization matters: It simplifies data interpretation. It highlights key......
Read More →
Supporting Integration: A Guide to Efficiently Integrating Custom Profiling Solutions into Your Development Workflow
Understanding Custom Profiling Solutions Custom profiling solutions help developers measure performance in software projects. They give insights into how code runs, identifying bottlenecks and areas for improvement. Why Integration Matters Integrating profiling tools into your development workflow is crucial. It helps your team quickly access performance data right where they work. This can save time and lead to better code quality. Steps for Efficient Integration Here’s how you can integrate......
Read More →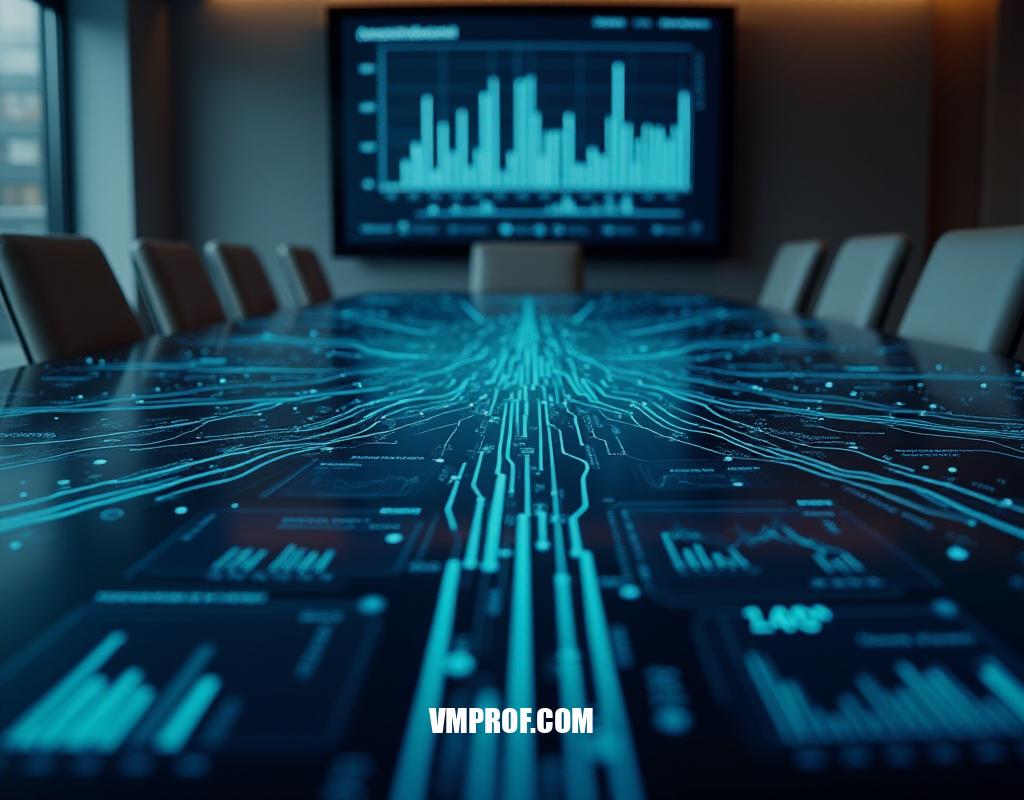
Creating a Robust Enterprise Analytics Framework
Creating a Robust Enterprise Analytics Framework Every business needs to understand its data. A solid analytics framework helps make sense of that data. In this article, we will look at how to create a powerful framework using developer tools, SDKs, and VMProf server hosting. What is an Analytics Framework? An analytics framework is like a backbone for your business intelligence. It combines different tools and technologies to gather, process, and......
Read More →
The SolidWorks Workflow Shortcut More Teams Should Know About
A practical look at how Solidise helps SolidWorks teams browse CAD files, check BOM and where-used context, and batch export PDFs, STEP files, DXFs, and release files with less repetitive manual work.
Read More →